pFI: Single Reagent on Column Assay, Nitrate


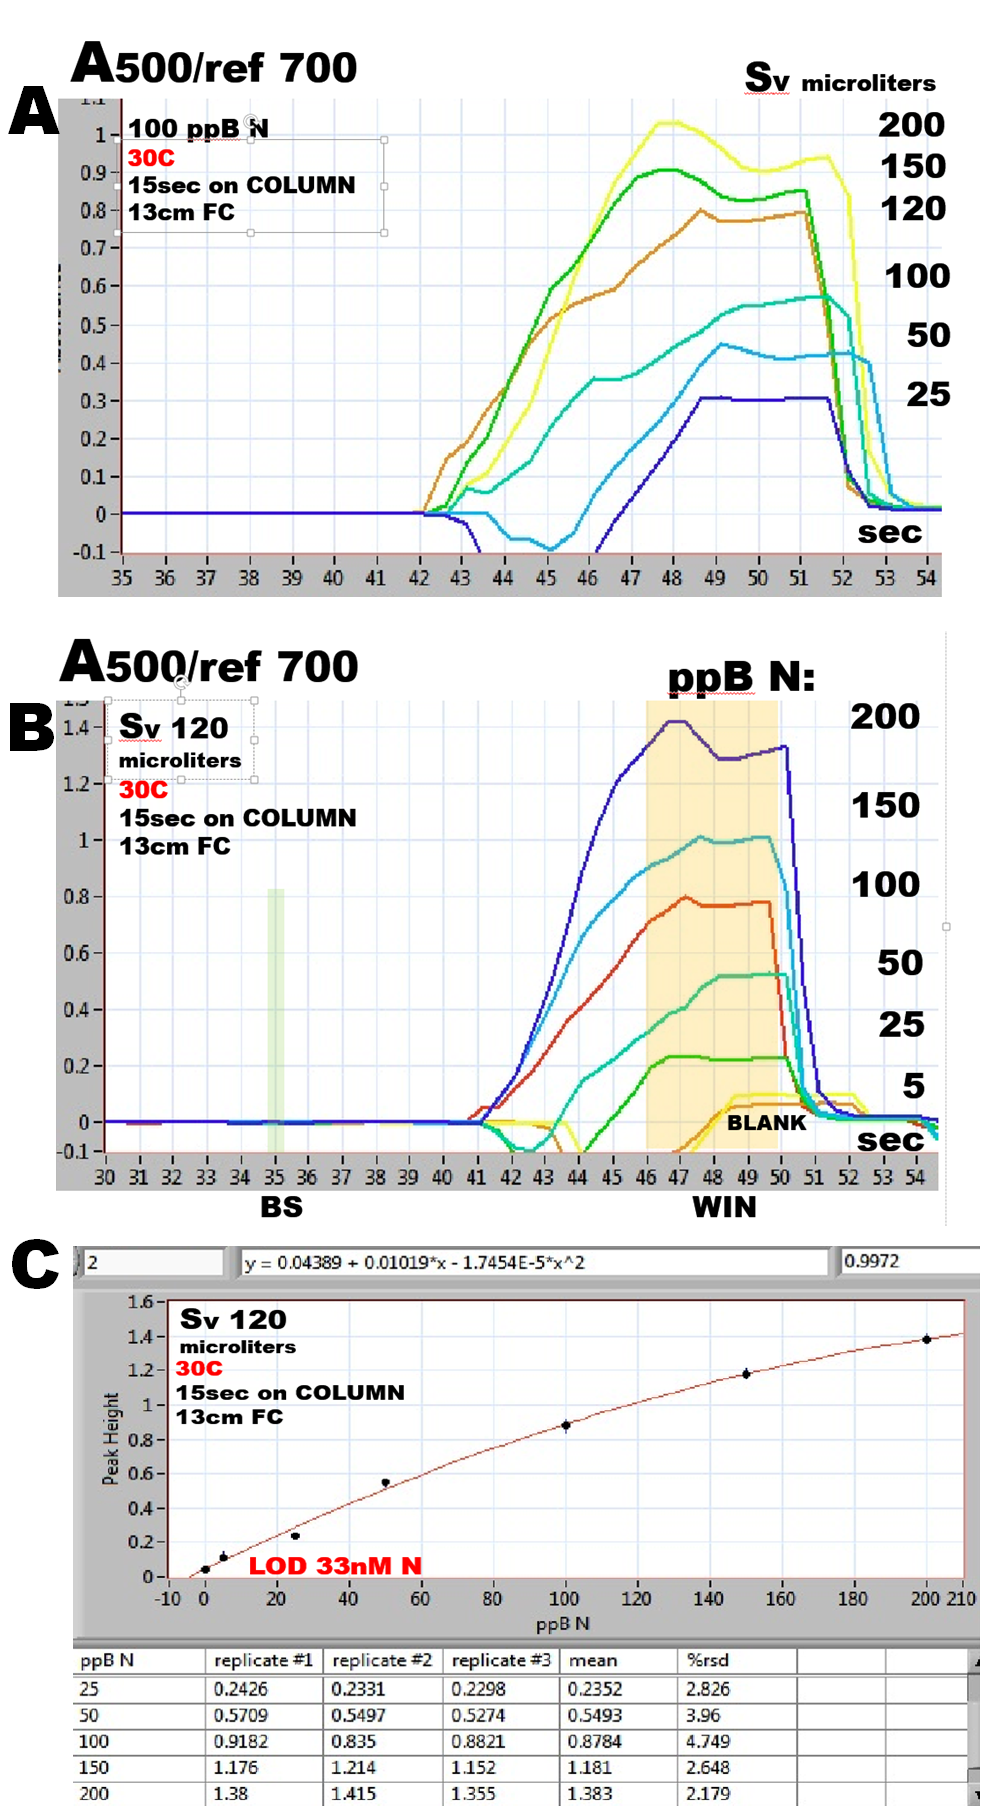
Sensitivity of flow Injection techniques increases linearly with increase of the injected sample volume Sv, until S1/2 value is reached (1.2.16.), while higher sample volumes yield progressively lower increases of the slope of calibration curve, until maximum is reached at Sv=5S1/2 value. By repeatedly analyzing 100ppB N nitrate sample and by increasing Sv, a series of response curves was recorded (A) yielding S1/2 of 60 mcrL. Therefore, in order to maximize sensitivity of this assay the Sv of 120mcrL was used for subsequent calibration experiments. Note that the limiting factor for peak height and maximum Sv value, is the transfer volume in step #2 of the assay protocol. Therefore further increase of sensitivity will require increase of amplitude of #2 and of all subsequent transfer volumes.
Calibration is the ultimate test of reproducibility of any method, and it was therefore performed by analyzing series of nitrate standards, in the range of 0 to 200ppB N, by means of the assay protocol outlined on the previous page. The response curves, shown superimposed (B) were evaluated by collecting peak height measurement in a window (WIN) and subtracting baseline data from BS interval.
Comparison of calibration data of pF (C) with data obtained by miniSI (2.2.21.) show average rsd 1.6% for SI and 3.3% average rsd for pFI, while LOD for SI and pFI are identical, and A values for 100ppB N are very close. Since pFI and mini SI used the same reagents and the same 10cm long Cd column, this comparison confirms feasibility of pFI protocol based on a sequence of complex microfluidic manipulations.
1.2.38.